Tag Archives: me

The Anti-Combines Laws & Merger Types

19 Aug

the anti-combined laws in economics
   The main importance of anti-combined policy (antimonopoly policy) is ideas to prevent industrial concentration or monopolization, to achieve locative efficiency and to promote competition. Even if many economists say that these are the main aims of this policy some of them may argue that anti-combined policies aren’t so effective and their goals aren’t always achieved.
   The main important anti-monopolistic idea is that they produce less output and charge higher prices than firms from competitive market system. In pure competition firms produce output quantity where P=MC. This equation is so important because P represents benefit that society gains from extra unit of output, while MC is the cost that society is ready to pay for that extra unit. When this equation occurs (P=MC) society doesn’t gain any higher total benefit by producing one more or one less unit of output. However, a monopolist doesn’t maximize profit by equating marginal benefit (not price) with marginal cost.  In this case, there is an under allocation of resources to this monopolized products, so that economic well-being of society is less than it would be with greater competition.
   It is said that in nineteenth century the market forces in monopolized industries don’t provide sufficient control over prices to protect consumers, achieve locative efficiency and get a fair competition. So there were two methods by which a government could control these market forces:

  • Regulatory agencies: In the markets where products or producing technology creates a natural monopoly, the government organizes public regulatory agencies that control economic behavior.
  • Anti-combined laws: in some kinds of market systems this control took form of anti-combined or anti-monopoly legislation that prevents the growth and development of a monopoly.

Anti-combined legislation depends on corporate size and concentration. That’s why it’s important to examine all merger types.

Merger Types
   There are three basic merger types. Let’s examine and describe them carefully bellow:

  1. A horizontal merger represents a merger between competitors that sell similar products in the market.
  2. A vertical merger is a merger between some firms at different stages of production process.  An example can be a merger between a firm that produces glass and another that produces plastic so that they may create windows that are sound-proof. Another example is that Pepsi, which is a supplier of soft drinks, and Pizza Hut, so that they supply food and drinks for these fast-food firms.
  3. A conglomerate merger may be defined as any merger that isn’t horizontal or vertical; it is a combination of firms in different industries or firms that operate in different geographical areas. This type of merger can extent the line of goods sold or combines some unrelated companies. An example of conglomerate merger is a union between Pizza Hut and some vehicle producing firms.

merger types

Optimal amount of Research and Development (R&D)

6 Aug

research and development in economics
How do firms decide what amount of research and development to use? This depends on the amount of marginal benefit and marginal cost firm gets after R&D activity. This decision comes from one basic rule of economics: In order to get the greatest profit a firm should expand a specific activity until marginal benefit (MB) will be equal to its marginal costs (MC). If a firm sees that a R&D activity brings more marginal benefit than the marginal cost then this firm should expand its activity. However, if marginal benefit is less than marginal cost then this R&D activity should stop or shouldn’t be started. R&D spending decisions is a complex one, because it involves a possible future gain for present sacrifice. While R&D spending is immediate the expected benefits are uncertain and may occur at some possible future point in time. The MB=MC idea is still relevant for R&D decisions.

Spending in R&D
In order to obtain funds for R&D activities firms have several options:
  Bank loans– Some firms are able to finance their R&D activities by obtaining loans from banks or other type of financial institutions. The cost of using this kind of funds is the interest rate paid to the lender. The marginal cost is the Future Value (FV) of money borrowed.
Bonds– Profitable firms may borrow funds for R&D by issuing bonds and selling them. In this case, interest is the cost paid by bondholders to lenders. In this case, again, marginal cost is the interest rate paid for money borrowed.
Retained earnings– some big firms may finance their R&D activity by retaining some earnings. In this case firm retains a part of its profit rather than paying dividends to its owners. Some undistributed corporate profit, called retained earnings, can be used to finance R&D activity. The marginal cost in this case is the rate that could be earned from interest as deposits in financial institutions.
Venture capital– A small start-up firm may be able to attract venture capital to attract R&D projects. Venture capital is simply money, not real capital. Venture capital is part of household savings that is used to finance high-risk business venture in exchange of possible future share if thus ventures succeed. Marginal cost of this type of financing is the share of expected profit that business will have to pay to these people that offered this money.
Personal savings– Sometimes entrepreneurs may finance R&D activities from their own savings. In this case marginal cost is the forgone interest rate.
To sum up, we may state that whatever are the funds for R&D, the marginal cost in all the cases is forgone interest rate, i. Let’s assume that interest rate is the same for all amount of money needed. Also, let’s say that a firm call EcoMoney must pay an interest rate of 10% for the least expensive funding available to it. Let’s draw a graph called interest-rate cost-of-funds curve that denotes marginal cost of each amount of money borrowed for 10% interest rate and is shown simply by a horizontal line. Let’s make a graph and a table that depicts this situation.
interest-rate cost-of-funds curve and graph
With this information EcoMoney want to determine how much R&D to finance in the next year.
Expected Rate of Return
Firm’s marginal benefit from each dollar spent on R&D is it is profit (or return) gained from it. Thus R&D is expected to result in a new product or production method that will increase firm’s revenue. This return isn’t guaranteed but it is possible, so there is a risk to invest money in research and development process. Let’s suppose that after considering all risks EcoMoney constructs an expected-rate of return versus research and development cost graph and table. Expected-rate of return curve is marginal benefit of each dollar spent on R&D. This curve slope is negative because of diminishing returns from R&D expenditures. A firm will direct its initial R&D expenditures to the highest expected-rate of return activities and additional funding will be invested in activities that offer successively lower rates of returns. Thus firm increases R&D spending it uses to finance R&D activities of progressively lower rates of returns.
expected rate of return graph and table

Optimal R&D spending
The figure bellow combines interest-rate-cost-of-funds curve and the expected rate of return curve. These two curves intersect at EcoMoney’s optimal amount of R&D, which is 35 million of dollars. This result can also be determined from the previous tables that showed amount of funding at various rates of return and interest cost of borrowing (in this case 10%). AT this point MR and MC from expenditures on R&D are equal. The firm should undertake all R&D expenditures up to 35 million of dollars, since these parameters yield higher marginal benefit and expected rate of return, r, than interest costs of borrowing money, i.
Optimal vs. affordable R&D
As we know there can be too much, or too little of a good thing. So it is with R&D and technological advance. The figures from above show that R&D expenditures make sense as long as the expected return equals or exceeds the expenditures needed to finance it. Many R&D expenditures may be affordable but also most of them aren’t worthwhile, because their marginal benefit is less than their marginal cost.
Not Guaranteed returns
    The outcome of R&D researches are expected, but not guaranteed. At the time of decision, it may look worthwhile, but they can’t predict with high accuracy future events, that’s why sometimes some R&D decisions are like an informed gamble and not as typical business decision. Invention and innovation carry with them high possibility of risk. So there may be a successful outcome or a costly disappointment.
Optimal level of R&D expenditures

Role of Entrepreneurs and Innovators

4 Aug

entrepreneur in economics
       Entrepreneurs: Entrepreneur is an innovator, initiator and a risk bearer- an element that combines labor, land and capital resources in new and original way so that this business may produce new goods and services. In past a single individual carried out all entrepreneur functions in a firm, but nowadays because of more technological complex economy, entrepreneurship is more likely to be carried out by entrepreneurial teams. Such teams may include two or three people working as their own bosses or developing new ideas, or this team may also consist of a larger number of entrepreneurs who are administrated their own financial resources.
   Other innovators In the process of producing are included other people who don’t bear personal financial risk. They may be scientists, key executives, or other employees engaged in Research and Development activities (R&D). (They are sometimes called intrapreneurs)
Start-Ups
   Sometimes entrepreneurs form some small companies called start-ups, these firms focus of developing and introducing new products or on creating a new production or distribution technique. An example from history, was when two people working in their garages, formed such a start-up in 1970s. After some time they have founded their own company: Apple Computers.
Innovating existing firms
   Innovators also work in already existing corporations, whether these are large or small. In this case innovators are salaried workers which are paid very well and get substantial bonuses and shares of the profit. R&D work in large corporations has produced very important technological advances in different production systems.
    However, some large firms have split their R&D and manufacturing part of firm and have formed new, more innovative firms.
Anticipating Future
   It’s extremely difficult to anticipate the future but that’s what innovators are trying to do. These people who have strong anticipation abilities and are highly-determined may be able to introduce new and improved products at the right time. If they do so, the rewards may very big, monetary and nonmonetary ones. In order to develop a product one should be very creative and rewards for his success may be some intangible rewards like personal satisfaction. Winners of this competition of innovations can reap huge monetary rewards in for of economic profits, stock appreciation and very big bonuses. An example can be Paul Allen and Bill Gates who founded Microsoft in 1970s and received by 2000 approximately 60 billion of dollars.
   Past success offer innovators and entrepreneurs access to further innovations that may anticipate buyers’ wants. Even if they may not succeed the second time, a try is also important. Market doesn’t care if the entrepreneurs and innovators are Canadian, Americans, Japanese, Chinese or Swiss. Main scope is innovation and better society.
Government and University Scientific Research
   Very small amount of money from R&D is spent on scientific research, because scientific principles can’t be patented and they don’t have immediate commercial uses. However, scientific knowledge is very important for technological advance. That’s why entrepreneurs try to find out the output of universities and government labs’ researches.
   Government and university labs have been the place where a lot of amazing technological inventions have been discovered. Computers and biotechnology are some results of experiments made there. That’s why firms tend to invest in university researches that are related to their products. Business founding of R&D at university has grow rapidly. Today scientists and universities understand that their work may have some commercial value, that’s why they are teaming up with innovators and share possible profits. However, some firms find it more profitable to make researches on their own. This is more common in pharmaceutical and computer industry where it’s uncommon to distribute new scientific knowledge generated in their labs.

Regulation of Monopoly

25 Jul

Regulations
   Sometimes natural monopolies are subjected to price regulation (rate regulation), although more important for now is to deregulate those markets where competitions is possible. Some examples may be provincial and municipal commissions that regulate the price of gas, electricity that suppliers are charging.

Regulation of Monopoly
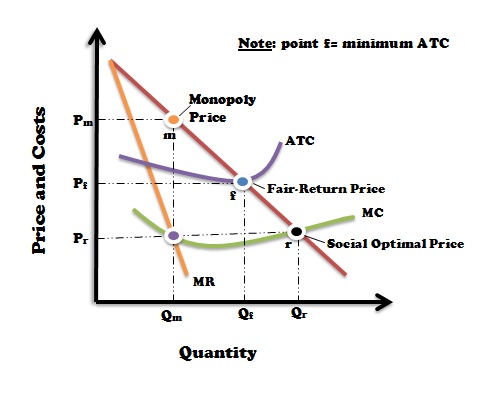
   In the figure above it is presented the regulation of local monopoly, for example the distributor of electricity. In this figure there are plotted demand curve and cost curves that our supplier is facing. Because of economies of scale demand curve cuts ATC curve at a point where this curve is still falling, so it’s inefficient to have more firms in this industry because each of them would produce a smaller quantity of output, thus they will operate at a point which is much more inefficient than for just one operating firm, since in short run their ATC will be higher than for just one single firm. So in this case it’s better to have just one seller.
   We know from MR=MC rule that Qm and Pm are profit maximizing output and price that is more likely to be chosen by monopolist. At the quantity Qm the produce will enjoy an economic profit. Since price exceeds marginal then an underallocation of resources (allocative inefficiency) is being present. How can government regulate the price so that this will bring better results for the entire society?

Social Optimal Price P=MC
   If the regulatory commission has the task to achieve the allocative efficiency then it will attempt to set a price where P  will be equal with MC. Each point on demand curve shows a price-quantity combination. So, at point “r” we will have Pr which is equal to marginal cost.
   Confronted with price Pr monopolists will maximize profits or minimize losses by producing Qr units of output. By making it illegal to charge a price higher than Pr , the firm won’t be able to produce other quantity of goods to increase the revenues.
   The regulatory commission can stimulate allocative efficiency to be produced by imposing the only legal price Pr and letting the monopolist to choose its profit-maximizing or loss-minimizing output. So, production will take place at point where Pr=MC, and this equality will indicate an efficient allocation of resources to this good or service. The price that achieves allocative efficiency is called socially optimal price.

Fair-Return Price P=ATC
   Social Optimal price, Pr, may be so low that the firm won’t be able to cover its average total costs (ATC). The result may be a loss for the firm. In our figure average total costs are more likely to be higher than Pr at the intersection of MR (P)=MC curve. Therefore forcing this firm to operate at social optimal price may result in short-run losses or even in bankruptcy in long-run.
   What to do in this case? One solution is to provide subsidies by government that will cover these losses. Another option for regulatory commission is to modify the allocative efficiency policy P=MC, so that firms may establish a fair-return price. In this case firms will have only a normal profit and this price is determined by intersection of ATC and demand curves (in our case point “f”). So Pf permits a fair returnfor firms. The corresponding output for this price will be Qf. In this case the firm will realize only a normal profit.

Regulation’s Dilemma
   Comparing results given by socially optimal price (MC=P) and fair-return price (P=ATC) sometimes and dilemma, called dilemma of regulation arises. When the price is set to achieve allocative efficiency ( P=MC) regulated monopoly is more likely to suffer losses. Conversely, when the price is set for productive efficiency/ fair-return price (P=ATC) monopolists can cover its costs, but in this case underallocation of resources problem is solved only partially, since the quantity output increases from Qm to Qf, while the social optimal price is Qr. Besides this dilemma regulations can improve results of monopoly from social point of view. Price regulation process reduces price, increases output, and reduces economic profit of monopolies.

Price Discrimination

24 Jul

Price Discrimination

      In all previous articles I assumed that monopolists charge a single price to all buyers. But under some conditions monopolists can increase their revenues by charging different prices to different demanders.  By doing this kind of act monopolist is engaging in price discrimination, the practice of selling of the same product to different buyers when the price difference aren’t justified by difference in cost.
   In order to engage in price discrimination there are some conditions that must be realized:

  • Market segregation– the seller should be able to differentiate the buyers into different classes, each of them having different wants and abilities to pay for the product.  This division of buyers is usually related to different elasticities of demand.
  • Monopoly power– another important characteristic is that seller should be a monopolist or at least to possess some monopoly power, so that he may control the quantity output and the price.
  • No resale-The original buyer mustn’t be able to resell the good or service. Otherwise, if the buyer from low-price segment is able to sell the goods purchased to buyers from high-price segment, then our seller will have some competition in high-price segment. This competition will reduce the price and will cancel seller’s price discrimination policy.

Examples of Price Discrimination
   Some movie theatre or golf clubs differentiate their charge on the basis of time ( lower rates in the night and higher rates in the evening) and age(younger- lower ability to pay, so less money is charged).  Another example can serve railroads where shipper of 1 tone of jewelry is charge more than a shipper of 1 tone of tomatoes.

Consequences of price discrimination
   Monopolist can increase its revenue by practicing price discrimination. At the same time, perfect price discrimination results in an increase of output. In this case each consumer pays the price that he or she is willing rather than to forgo the product.
   Other things equal, the monopolist that practices perfect price discrimination is producing a higher quantity of output than the monopolist that isn’t practicing it. When the non-discriminating monopolist lowers its price to sell additional unit, this lower price is applied not only to additional output but also to the prior units. So the non-discriminating monopolist’s marginal revenue falls more rapidly than the price and, marginal revenue, graphically, lies below demand curve. However when a discriminating monopolist lowers its price, this reduced price is applied only to additional units sold not to prior units. Thus marginal revenue equals price for each unit of output, graphically MR and Demand curve coincide.
   Although price discrimination results in more economic profit than that achieved by single price monopolist, it also results in greater output, so less allocative inefficiency.

Price Discrimination

Price Discrimination